Reviewer 1Accept
“I showed my thesis advisor a chart proving ice cream sales cause shark attacks. I no longer have a thesis advisor. 10/10.”
Dr. Graphs McChartface, tenured in nothing
AbstractUsing 292 public datasets and an alarming amount of confidence, we show that anything correlates with something. Pick a variable, we find its statistically significant soulmate, and our model writes the press release.
Keywords: correlation · causation (not) · turtles · vinyl
2 free analyses · no account needed · ¹ results may be meaningless
Choose an independent variable. We search every other dataset for a suspiciously good match, then generate a figure worth sharing.
Got your own numbers (sales, visitors, your weight)? Upload a spreadsheet, a chart screenshot or a PDF and we'll find what correlates. Bring your own data →
Choose variable A first. We'll list everything that moves in suspicious lockstep with it, sorted by |r|.
Your figure appears here.
Pick two variables, or draw a random sample.
Adds an AI background, a headline and the statistics to prove it.
Every analysis becomes a figure with its own page, ready to share, cite, or print on a mug.
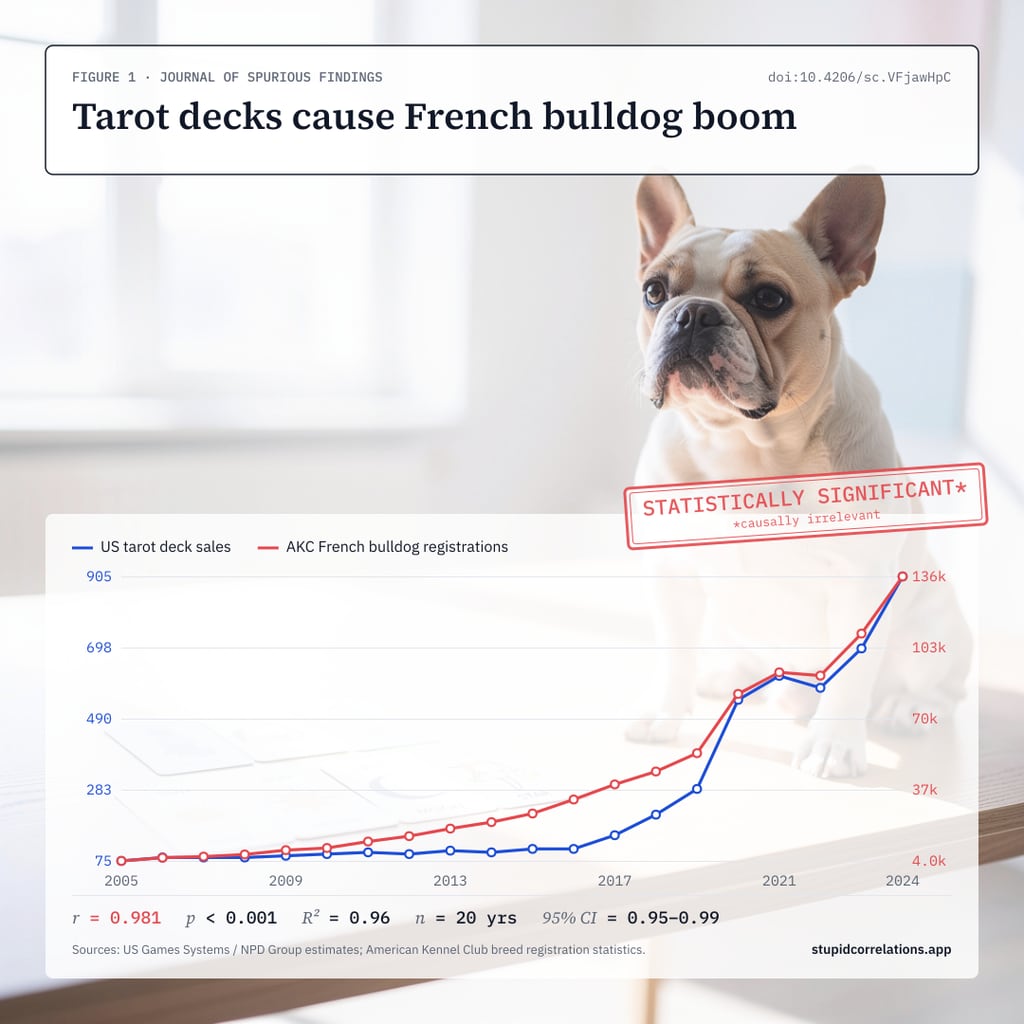
More tarot readings lead directly to a surge in French bulldog popularity. The stars have spoken.
“Our research definitively shows that seeking canine companionship is written in the cards, literally.”Dr. Astro Canine, Mystical Pet Statistician
Animated figures with narration by a very serious voice. Tap one to play it, sound on.
Our findings have been reviewed by a panel of independent experts, most of whom exist.
“I showed my thesis advisor a chart proving ice cream sales cause shark attacks. I no longer have a thesis advisor. 10/10.”
“Methodologically indefensible. Also, I have sent it to my entire family group chat.”
“Put a correlation chart in my quarterly presentation. Got promoted. My boss still thinks cheese consumption drives our revenue.”
“Proved to my wife that doing dishes correlates with lower WiFi speeds. The r-value was 0.94. ZERO POINT NINE FOUR, LINDA.”
“My grandson showed me this. I now send correlation charts to my book club instead of Bible verses. Doris hasn't spoken to me since.”
“Made my first chart in 7 seconds. NASA took longer to reject my application. Coincidence? The r-value says no.”
Research is expensive. Ours isn't.